Do you have data and/or analytic skills? Fight Covid-19 with us! We're looking for volunteers to compile data for other regions and cities, and help with the analysis. Learn data science with us by volunteering.
Data Visualizations
- Covid-19 Dataset for the PhilippinCovid-19-DOH-Dataes - DOH Data Drop
- Covid-19 Dataset for Hospital UtilizCOVID-19 Hospital Utilizationation - compiled by Mr. Dominic Bolinas
- Covid-19 Dataset for Region VI - compiled by Dr. Pia Zamora (USA-CFI), Mr. Dominic Bolinas (UP Manila), Ms. Xena Estinoso (USA), Mr. KC Machan (UCOVID-19 Region VI DatasetSA), Ms. Zoe Tan (USA), and Ms. Erica Torrato (USA)
Covid-19 Dataset for Quezon City (currently being updated)
Sars-Cov-2 Variant (Genomic) Surveillance
Southeast Asia
Southeast Asia COVID-19 Map
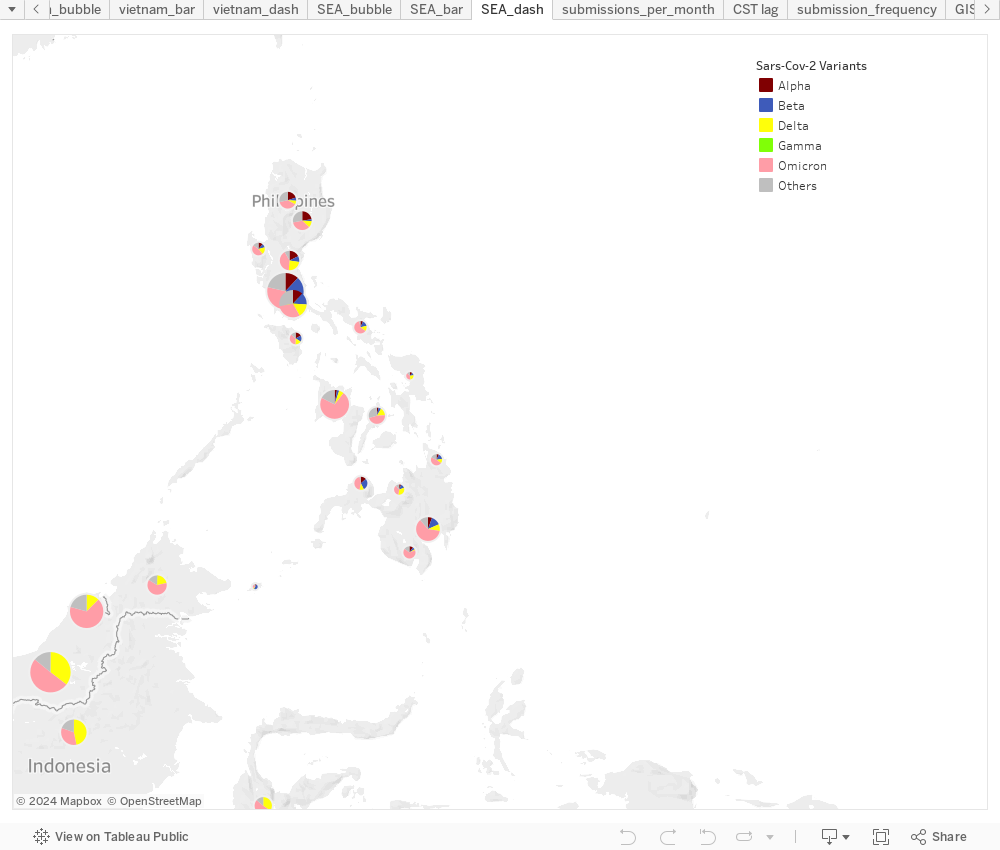
See the Sars-Cov-2 variants in Southeast Asian countries.
Brunei | Cambodia | Indonesia | Laos | Malaysia | Myanmar | Philippines
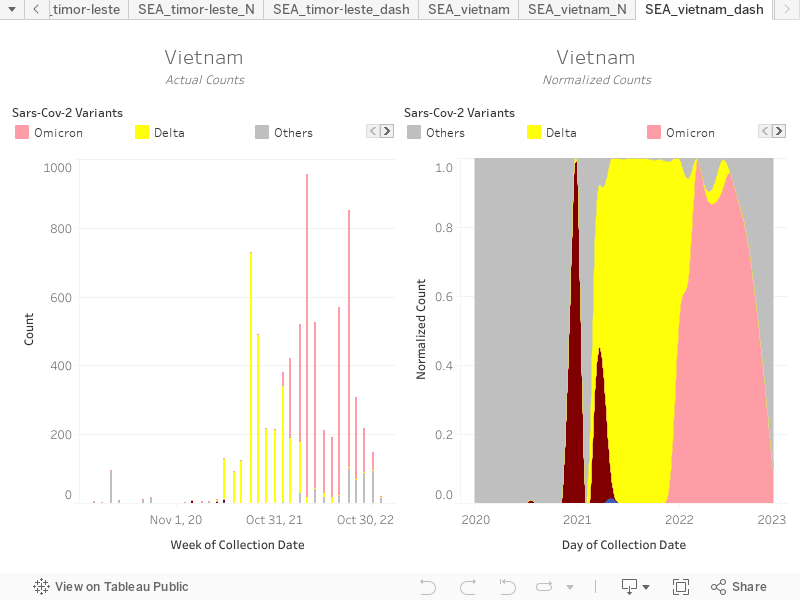
Singapore | Thailand | Timor-Leste | Vietnam
To filter the variants shown in the visualization (above), click on the legend icons of the graph. The complete list of the World Health Organization (WHO) labels for the variants of concern and variants of interest can be found in this link.
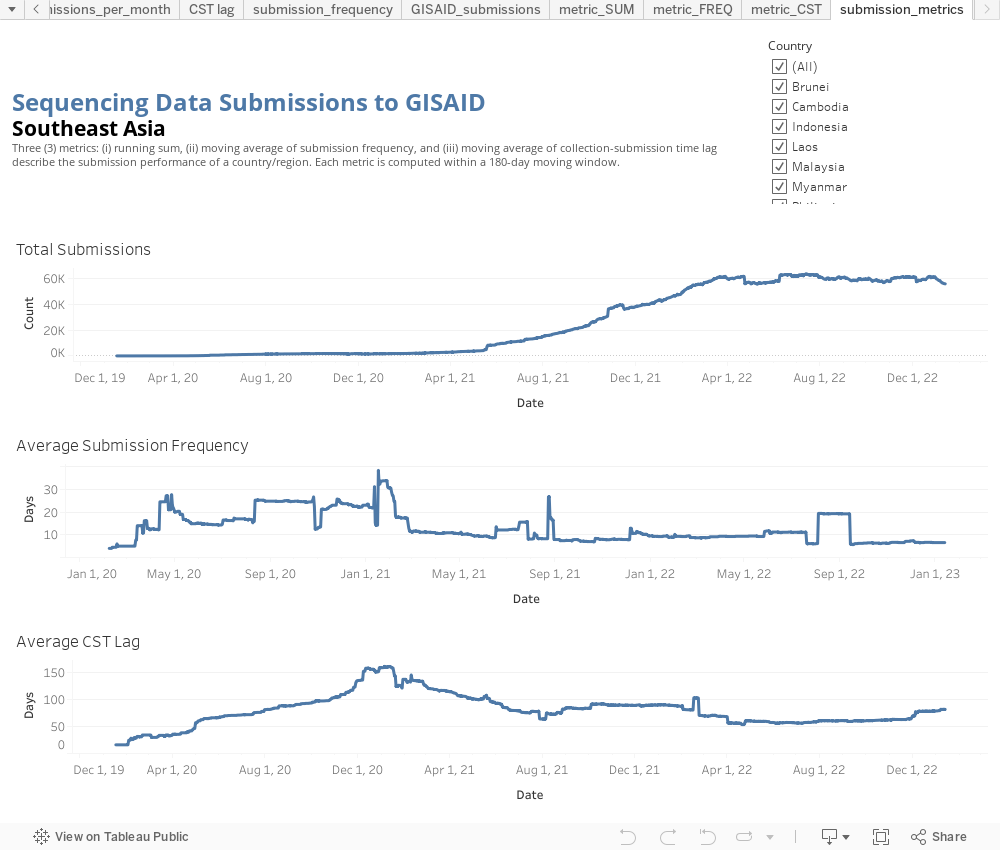
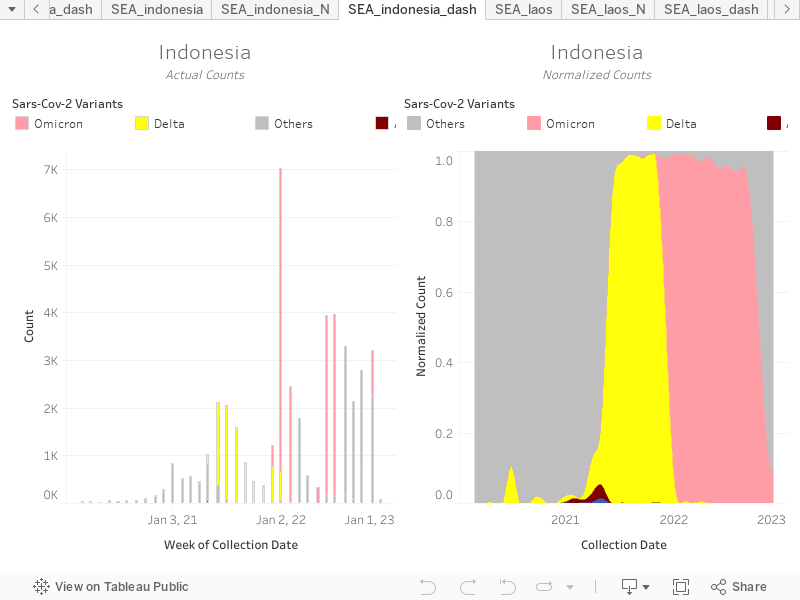
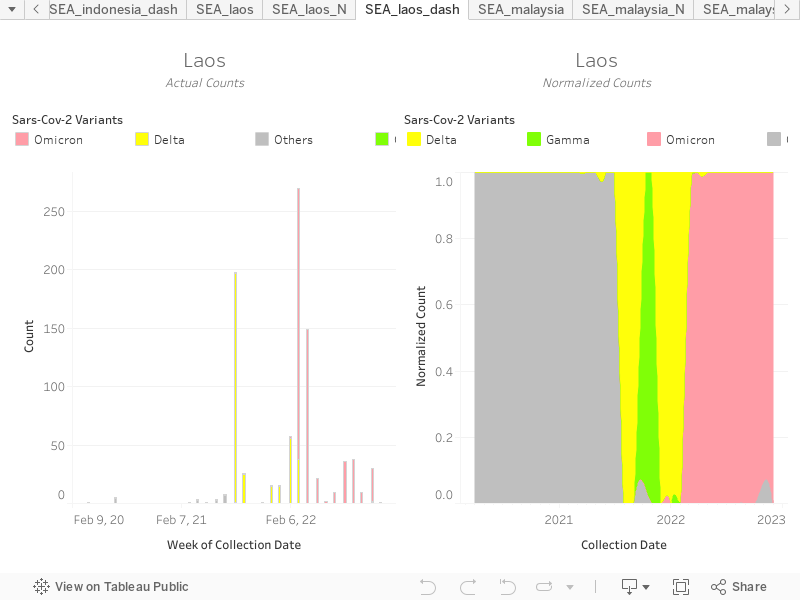
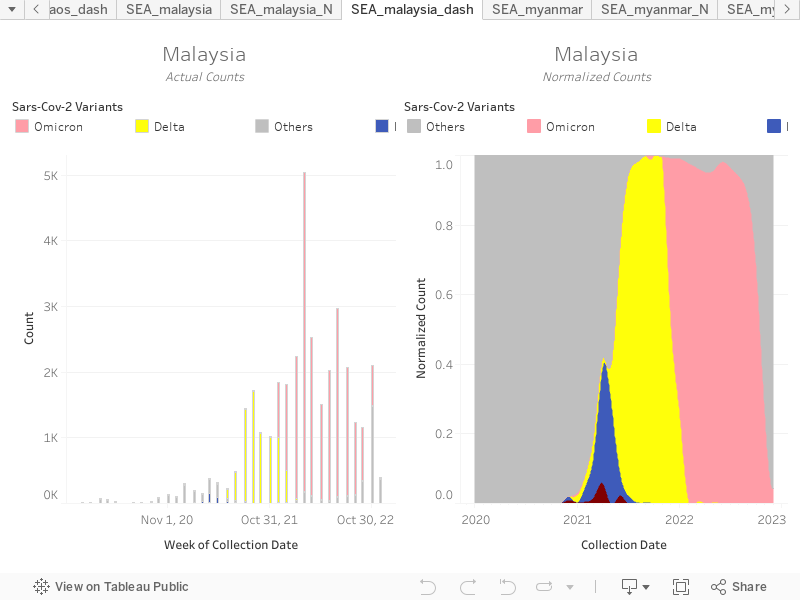
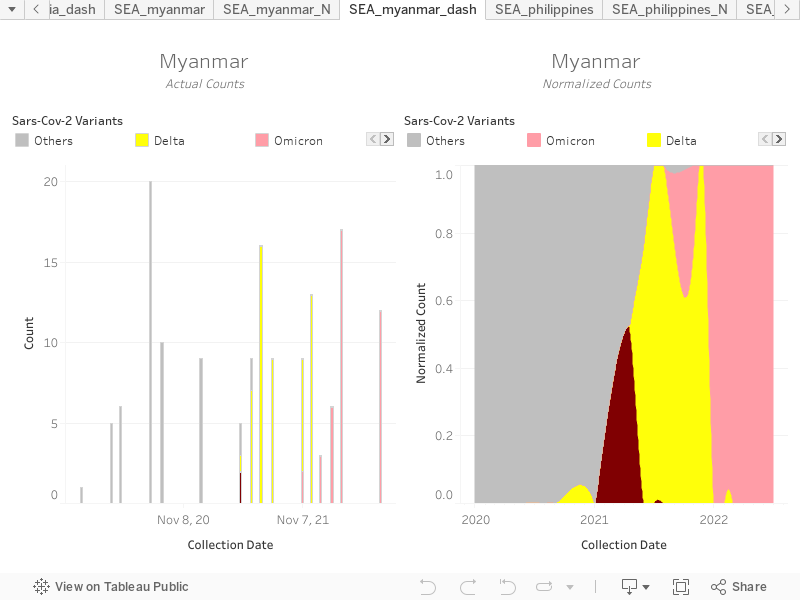
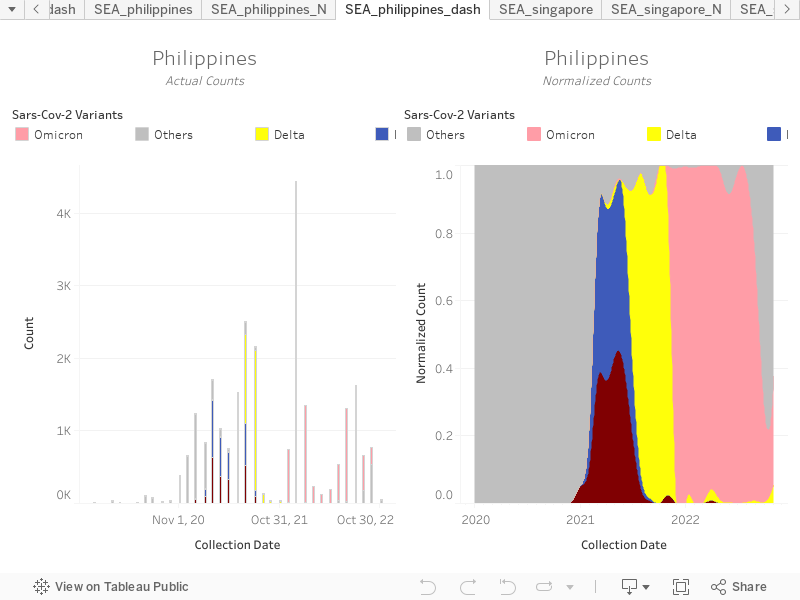
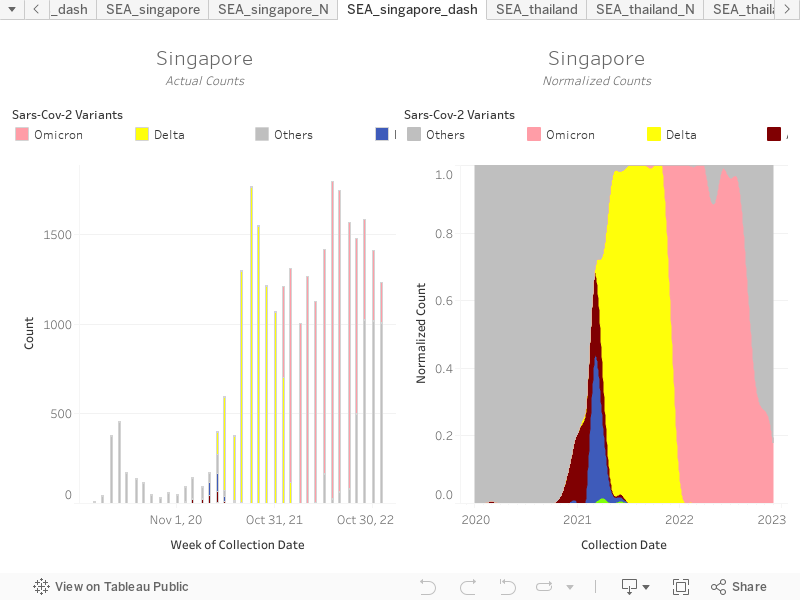
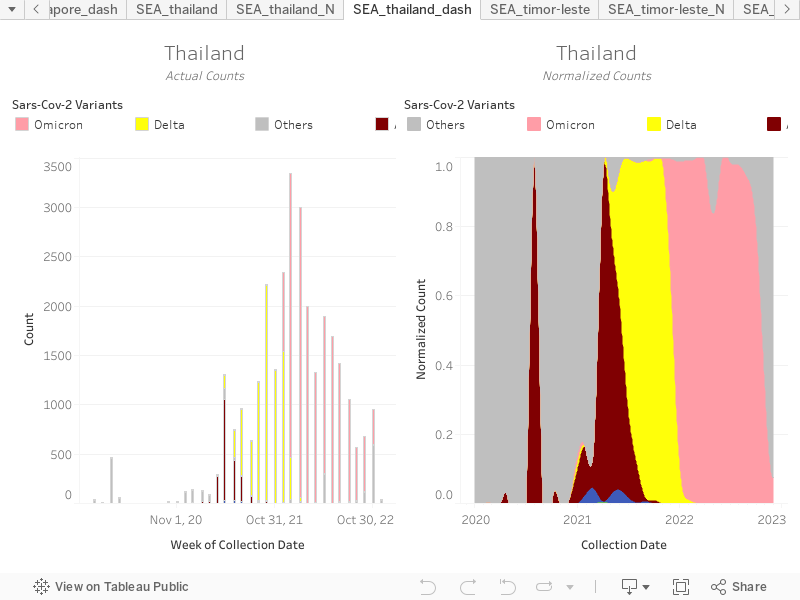
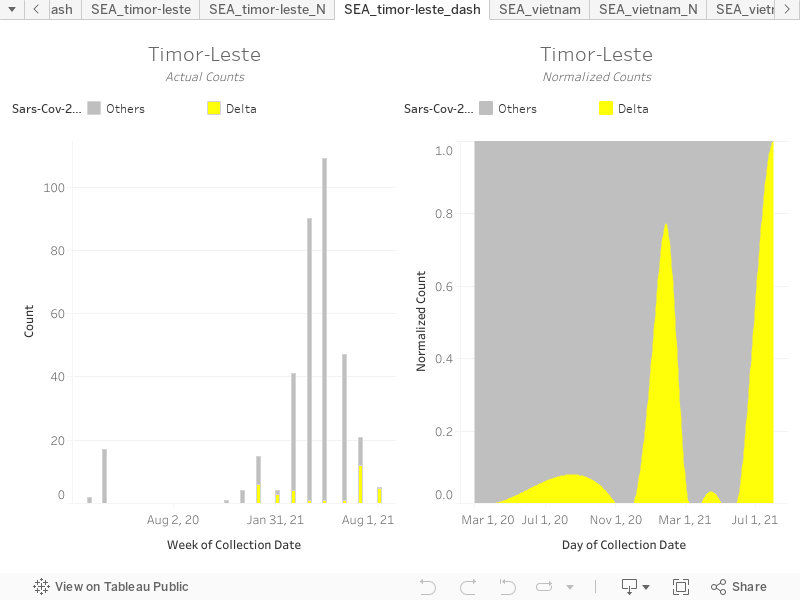
The distribution of SARS-CoV-2 variants in Southeast Asia is shown in the following figures. The viral sequences were downloaded from GISAID, an open-access website dedicated to sharing genomic sequences of SARS-CoV-2 and influenza viruses. Tracking these variants is very important because they may have very specific and distinct qualities: some variants may have more infectivity increasing the positivity rate, while some may have increased lethality increasing the case-fatality rate. These characteristics may be correlated with what is happening locally.
With these visualizations our COVID-19 response can be targeted i.e., in terms of vaccines, hospital resources, public health policies (quarantines) etc, depending on the variants in a specific region. This is for people to know about the pandemic in their respective areas, and to optimize resources and manpower, to promote a more effective response by local health authorities. The recently developed vaccines may have varying degrees of efficacy against the variants (an active area of investigation). Therefore, monitoring variant sequences is very important to be able to improve our localized as well as overall public health response.
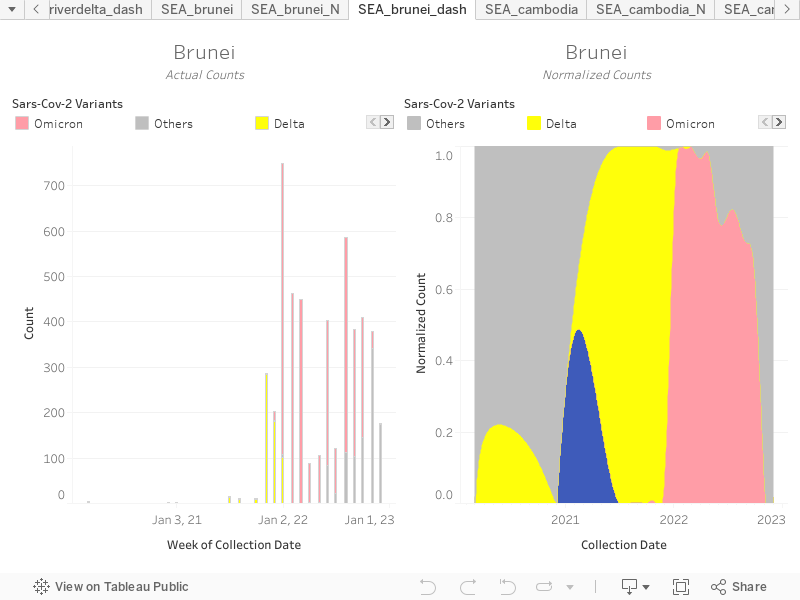
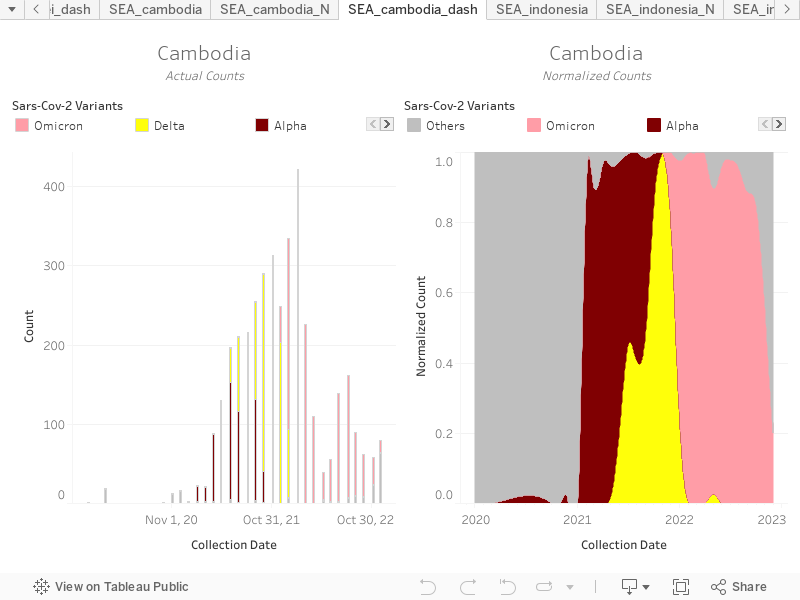
Which variants are predominant in each country?
Due to the cost of sequencing, each country conducts different sampling strategies to only sequence a representative portion (less than 1%) of samples that tested positive in COVID-19. With such small sequencing data uploaded to public databases such as GISAID, it is difficult to extract general insights (e.g. the percentage of samples that are Delta variants in a certain period of time) from the plots of actual counts. Thus, we normalized the counts per collection month and smoothened the data points with 1-D spline interpolation of the third order to maximize representativeness of such small data. On the other hand, plots of actual counts give us the confidence level of our insights because larger counts provide better statistical confidence.
Last Updated: December 31, 2022